Explore the Dashboard
A quick tour of the Blazrlytics diagnostic dashboard. Everything described here is running live on this site — open the dashboard and follow along.
Blazrlytics offers two ways to access the same diagnostic data:
On-Page Overlay
A built-in panel that opens from the Blazrlytics icon at the bottom of every page. Perfect for quick inspections during development.
Chrome DevTools Extension
A dedicated panel inside Chrome/Edge DevTools. Ideal for deeper debugging sessions alongside the Elements and Network panels.
Chrome Web Store →Both options provide identical functionality. The sections below apply to either.
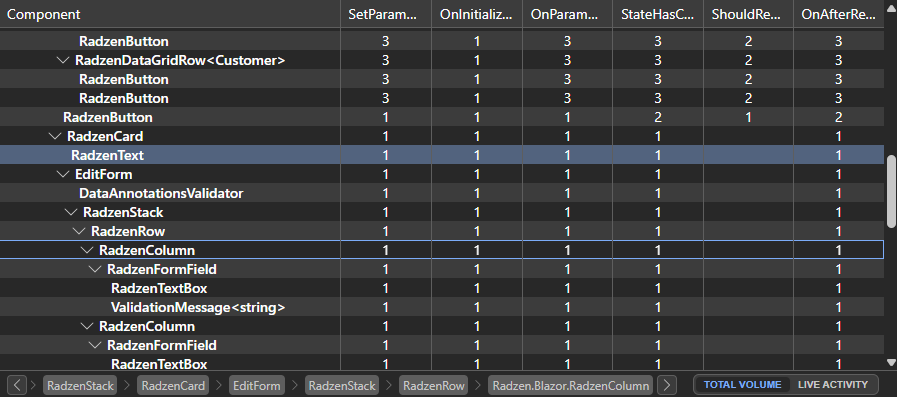
Visualise Your Component Tree
The Components view displays your application's live component hierarchy. See which components are currently rendered, their nesting structure, and watch DOM highlighting flash as components re-render. Click any component to inspect its current parameters and state.
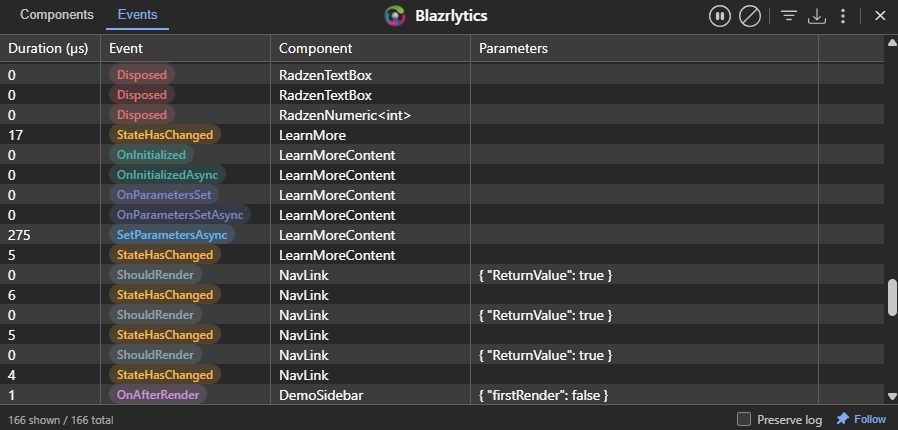
Trace Lifecycle Events in Real Time
The Events view captures every lifecycle event as it happens — OnInitialized, OnInitializedAsync, SetParametersAsync, OnParametersSet, ShouldRender, OnAfterRender, and more. Each event is recorded with microsecond-level timing, making it easy to spot slow renders and unnecessary re-renders.
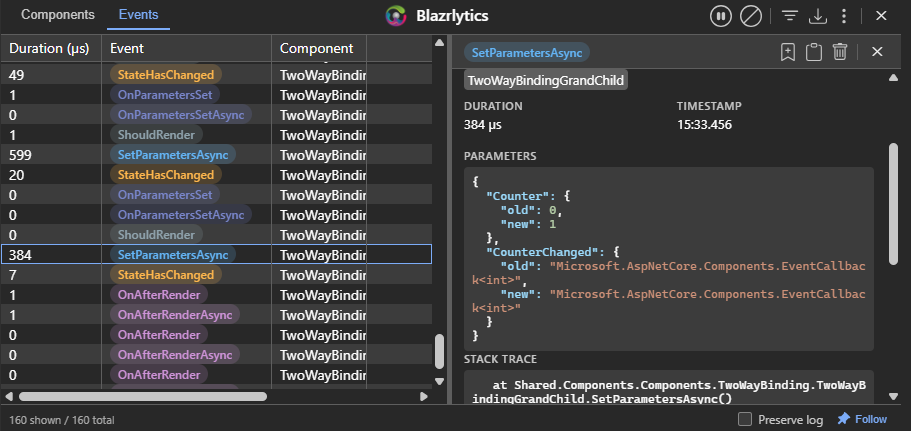
Deep Dive into Individual Events
Click any event to see its full detail. For parameter-related events, Blazrlytics shows an intelligent parameter diff — highlighting exactly which values changed and which stayed the same. Stack traces are available when enabled, giving you the complete call chain that triggered the render.
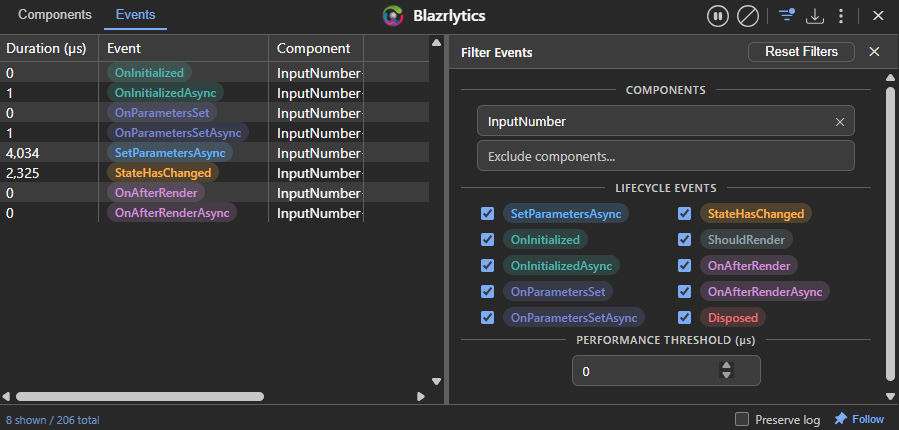
Cut Through the Noise
Real applications generate thousands of lifecycle events. The filtering panel lets you narrow down by component name, namespace, event type, or minimum duration. Focus on the components and events that matter — whether you're hunting a performance bottleneck or debugging unexpected re-renders.
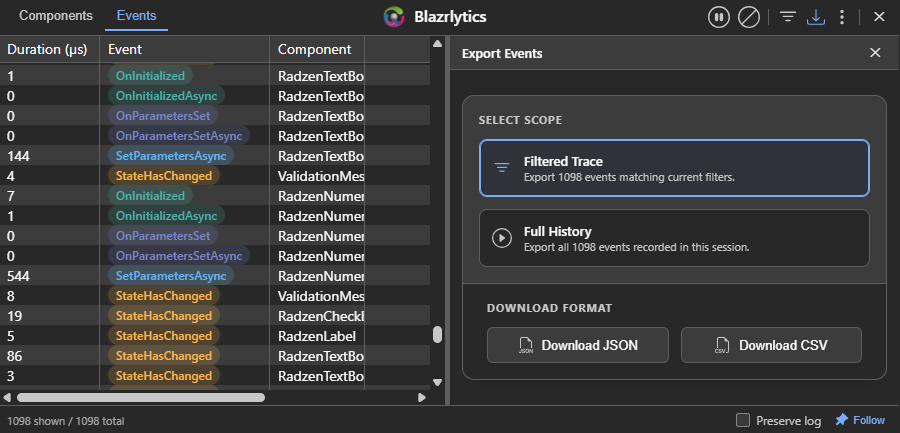
Export for Analysis or Sharing
Export your captured event traces to CSV or JSON format. Share performance data with your team, import it into a spreadsheet for analysis, or use it to establish rendering performance baselines for your application.
See It in Action
Everything described on this page is running live on this site right now. Open the dashboard and explore the feature demos to see Blazrlytics capture real component events.